Skip to content





An employee app can disseminate information more quickly, reduce the number of enquiries and provide staff with mobile access to knowledge or internal services. However, whether this results in a financial benefit cannot be determined solely by looking at downloads, logins or ‘likes’. To build a robust business case, companies must consider the total costs, measurable changes and the actual attributable benefits as a whole.
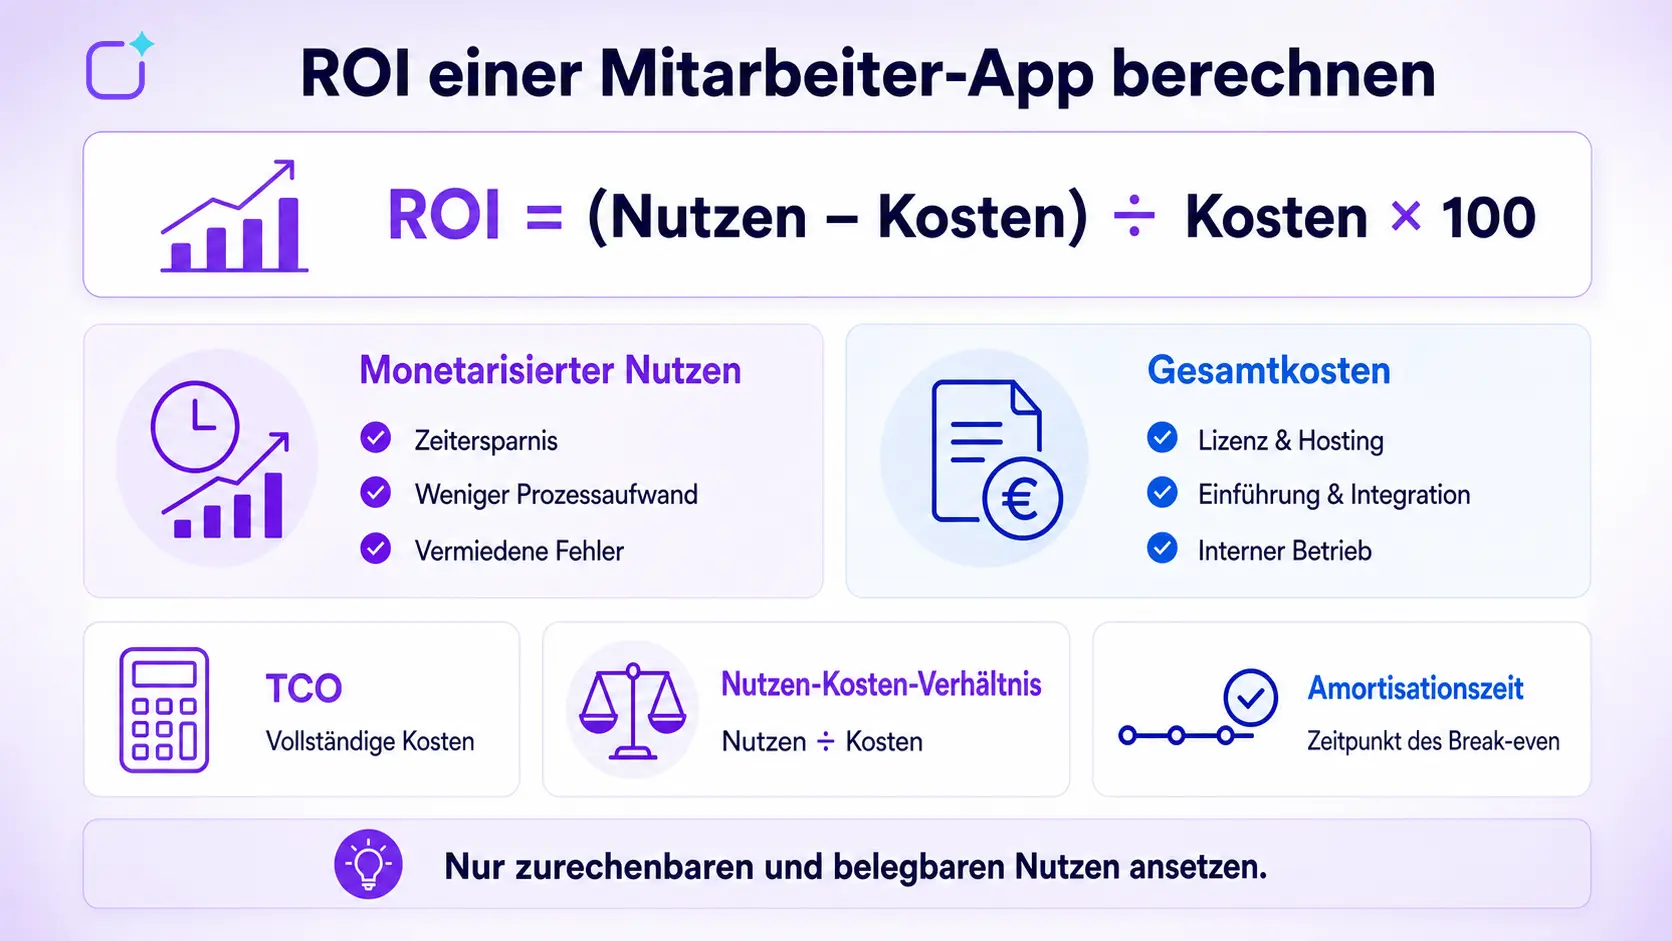
In short: The ROI of an employee app is calculated using the formula: (monetised benefits – total costs) ÷ total costs × 100. Costs include licensing, roll-out, integrations and internal operations. Benefits may arise from time saved, fewer manual processes or errors avoided. Reach and activity are important early indicators, but do not yet represent a financial return.
What does ROI mean in the context of an employee app?
ROI stands for Return on Investment. This key performance indicator compares the net financial return on an investment with its costs. An ROI of 25 per cent means that, after deducting all relevant costs, the net return amounts to 25 per cent of the investment.
It is important to distinguish this from the total return. If the ROI is 25 per cent, the total monetised benefit is 1.25 times the costs. Accordingly, an ROI of 100 per cent does not mean that only the investment has been recouped, but that, in addition to the costs being covered, a net profit of the same amount has been generated.
With an employee app, the formula is simple. The data underlying it is not. Communication, knowledge, processes and the employee experience often interact. It is therefore essential to document what changes have been observed, how they are assessed in financial terms, and what proportion can plausibly be attributed to the app.
The formula for calculating the ROI of an employee app
ROI as a percentage = (total monetised benefits – total costs) ÷ total costs × 100
In addition, three further key figures are helpful:
- TCO, or Total Cost of Ownership: all one-off, recurring and internal costs over a standard period.
- Cost-benefit ratio: total monetised benefits ÷ total costs. A value greater than 1 means that the assessed benefits exceed the costs.
- Payback period: the point in time at which the cumulative benefits first equal the cumulative costs.
ROI, TCO and payback period answer different questions. ROI describes the relative return. TCO shows the full cost base. The payback period indicates how long capital remains tied up. All three should therefore be taken into account when making an investment decision.
Which costs should be included in the calculation?
Looking at licensing costs in isolation distorts the ROI. The cost side should use the same time frame and the same assumptions as the benefit side. To ensure a fair comparison, it is often advisable to consider a three-year period.
One-off external costs
This may include set-up, configuration, branding, migration, interfaces, security checks, training and the release of a bespoke app. Which tasks are actually required depends on the deployment model and the scope of the project.
Recurring external costs
These include licence or usage fees, hosting, support, any additional modules booked, integration services and, where applicable, service levels. The terms and conditions must be set out in the specific quotation.
Internal project costs
Project management, technical coordination, data protection assessments, works council involvement, content preparation, testing and internal communication also take up working time. These activities should be valued using transparent internal charging rates.
Ongoing internal operating costs
Following the launch, there will be costs associated with editorial work, approvals, user management, moderation, analysis and further development. Automated identity or HR integrations can reduce manual work, but may incur their own implementation and operational costs.
The article ‘How much does an employee app cost?’ provides a detailed breakdown by price and cost categories. It also includes a three-year breakdown of the total cost of ownership.
Which benefits can be reliably monetised?
Not every benefit of an employee app can be directly converted into euros. A robust business case starts with specific usage scenarios and a documented baseline. Changes for which process times, volumes or costs are already known are particularly suitable.
Saves time when searching for and distributing information
If employees can find guidelines, contacts or up-to-date documents more quickly, this can free up working time. To quantify the financial benefit, you need to know the people involved, the average time saved, the frequency of use and a realistic estimate of the proportion of that time spent productively.
Annual benefit = number of people affected × hours saved × full cost rate × proportion that can be used productively
The proportion that can be put to productive use prevents the assumption that every minute saved is fully realised as financial return.
Less manual distribution of information
Printed notices, circular emails, telephone chains or parallel distribution lists involve effort in terms of creation, coordination and maintenance. Measurable benefits include, for example, savings on printing and postage costs, as well as reduced editorial and coordination time.
Fewer queries and corrections
Up-to-date information tailored to specific target groups can help reduce repeat enquiries or errors. Suitable data sources include helpdesk tickets, call volumes, corrective actions or documented process deviations before and after implementation.
Digitised forms and workflows
If paper-based or manual processes are made accessible via the app, it becomes possible to measure lead times, processing times, media breaks and error rates. The benefit does not stem from the form alone, but from the actual improvement in process performance.
Costs avoided through faster crisis or regulatory communications
In the case of safety-related alerts, location reports or mandatory information, improved accessibility can reduce organisational risks. However, such effects should only be quantified in monetary terms if reliable data on losses, errors or processes is available. Otherwise, they remain visible as strategic or qualitative benefits.
Staff retention and staff turnover
Better communication can contribute to the employee experience. However, staff turnover is also influenced by leadership, remuneration, working conditions, development opportunities and other factors. It is therefore not methodologically sound to attribute a change in staff turnover entirely to the employee app. What is possible is a cautious scenario analysis using a well-founded attribution factor.
Reach does not equal ROI: the right KPI chain
An app can only be commercially successful if it reaches relevant target groups and is actually used. Usage data is therefore necessary, but should not be equated with business value.
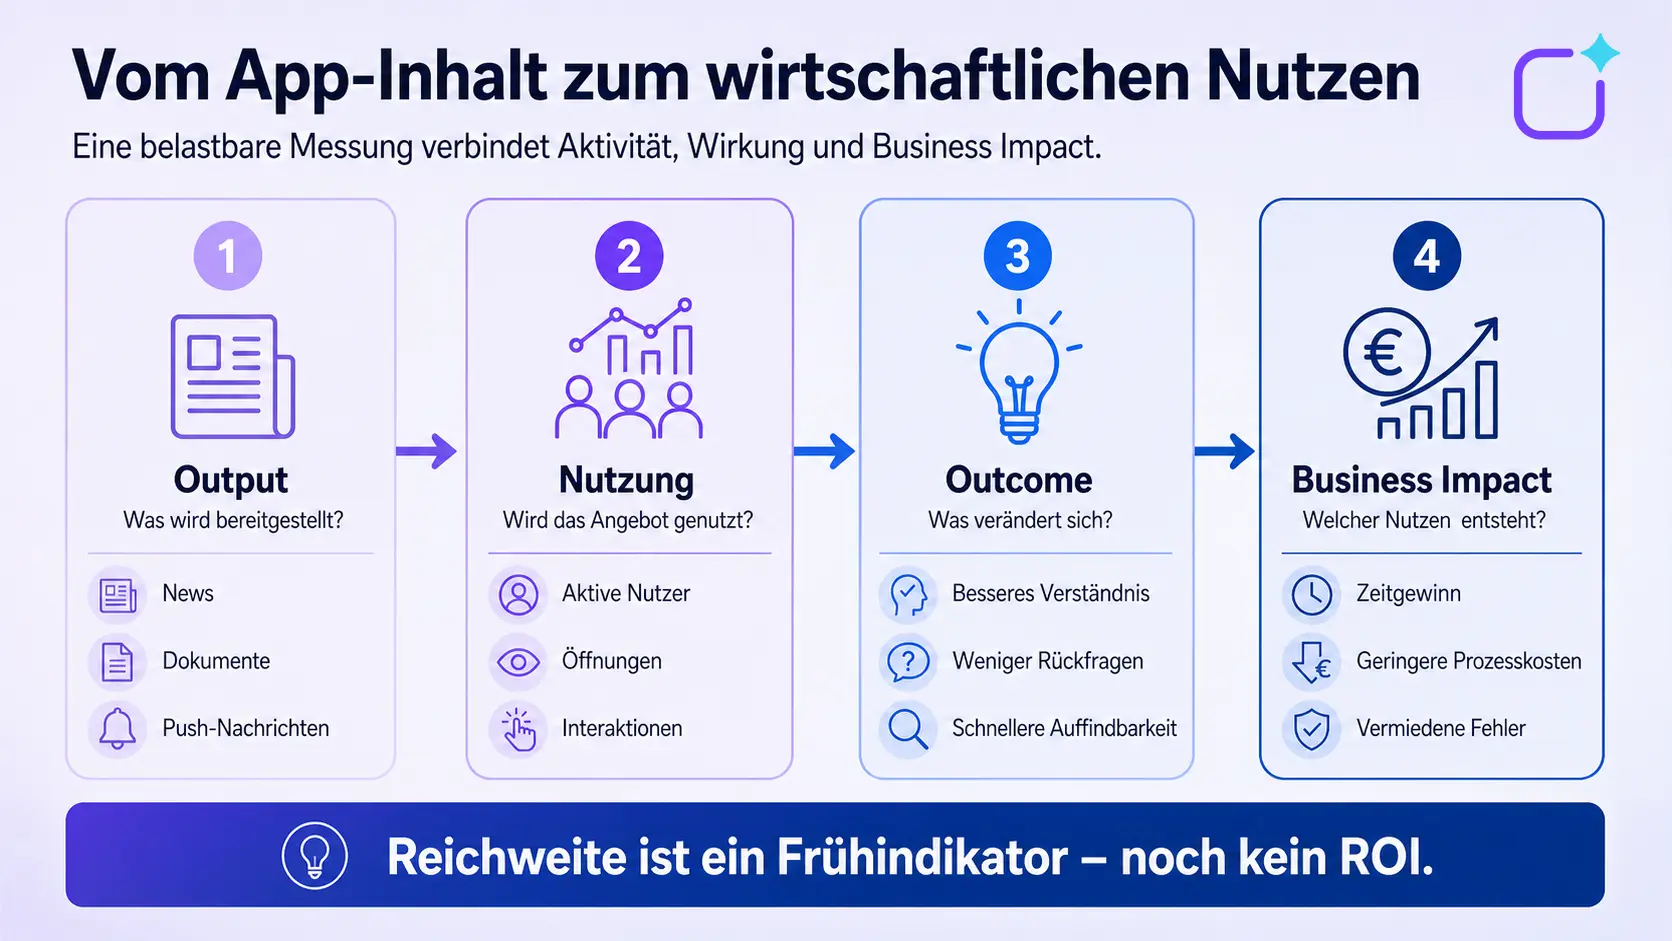
In its Integrated Evaluation Framework, the Association for Measurement and Evaluation of Communication (AMEC) distinguishes between outputs, reactions or out-takes, outcomes and organisational impact. This approach can be applied to a staff app:
| Level | Key question | Examples of an employee app |
|---|---|---|
|
Output |
What has been provided? |
Published news, documents, push notifications, forms |
|
Usage and response |
Is the offer being accessed and used? |
Activation rate, active users, opens, search, participation |
|
Outcome |
What is changing in terms of target groups? |
Comprehension, ease of finding information, satisfaction, fewer queries |
|
Business Impact |
What organisational benefits does this bring? |
Time saved, lower process costs, fewer errors |
An increase in active users is a positive indicator of usage. It only translates into a return on investment (ROI) once a traceable chain of effects leading to a financially quantifiable outcome has been demonstrated. The AMEC framework recommends setting targets and baseline figures before measurement begins, and not limiting oneself to mere activity metrics.
How to create a robust data foundation
1. Define the business objective and usage scenario
Don’t start with a general question such as ‘Is the app worth it?’. Instead, set out a specific objective: for example, reducing the weekly time taken to distribute location information, delivering mandatory information more quickly, or shortening the processing time for a frequently used form-filling process.
2. Record the baseline before the launch
Document the initial situation before the app is rolled out. This includes process duration, volumes, channel costs, queries, errors, printing costs and the current reach. Without a baseline, it is almost impossible to assess any subsequent changes in a reliable manner.
3. Define the measurement period and target group
Compare identical time periods and comparable target groups. Take into account seasonal factors, staff changes, production peaks or concurrent change projects.
4. Isolate the effect as far as possible
A pilot site, a phased roll-out or a comparison of similar groups can help to distinguish the effects of the app from other changes. If isolation is not possible, a conservative attribution factor should be used and disclosed as an assumption.
5. Calculate sensitivity
Create at least three scenarios: conservative, realistic and ambitious. Do not vary the final value arbitrarily; instead, vary the uncertain input variables, such as usage, time saved, hourly rate or allocation factor.
6. Document assumptions and sources
Every figure should have a source: system measurements, time-based data collection, the helpdesk, accounts, a survey or an approved budget. This ensures that the calculation remains verifiable and can be updated later with actual data.
The necessary analysis, role-based and integration requirements should be taken into account right from the start when selecting an employee app. Technical data flows can be linked to existing systems via suitable APIs and integrations.


Sample calculation: ROI of an employee app over two years
The following model calculation is not a real Polario client case. It is intended solely to demonstrate how costs, benefits and assumptions can be brought together in a transparent manner.
A company wishes to provide 500 employees with mobile access to up-to-date information, documents and two frequently used form-based processes. For the cost-benefit analysis, only effects that can be plausibly substantiated by baseline measurements or process data are taken into account.
Assumptions for Year 1
| Benefits section | Assumption | Calculated benefit |
|---|---|---|
|
Faster information retrieval |
300 regular users × 6 minutes per week × 46 weeks × 35 euros per hour × 50 per cent productive usage |
24,150 euros |
|
Less effort required for distribution and maintenance |
8 hours per month × 12 months × 35 euros per hour |
3,360 euros |
|
Digitised routine processes |
documented savings on processing and material costs |
4,800 euros |
|
Corrections avoided |
verifiable process errors, assessed with caution |
3,000 euros |
Total monetised benefit in Year 1: 35,310 euros
Costs for Year 1
| Costs section | Amount |
|---|---|
|
Licence and hosting |
14,000 euros |
|
Set-up, configuration and implementation |
8,000 euros |
|
Internal project and roll-out costs |
10,000 euros |
|
Editorial, administration and performance measurement |
6,000 euros |
|
Total costs for Year 1 |
38,000 euros |
ROI in Year 1 = (35,310 – 38,000) ÷ 38,000 × 100 = –7.1 per cent
A loss in the first year does not automatically mean failure. One-off set-up and roll-out costs are offset by usage that has yet to build up.
For year 2, the company assumes a benefit of 40,000 euros and running costs of 20,000 euros. Over both years, this results in:
- Cumulative benefit: 75,310 euros
- Total costs: 58,000 euros
- Cumulative net income: 17,310 euros
- ROI over two years: 29.8 per cent
- Cost-benefit ratio: 1.30
The model calculation also illustrates the correct interpretation: an ROI of 29.8 per cent means that, once the estimated costs have been covered, a net return of around 0.30 euros per euro invested remains. The total monetised benefit amounts to around 1.30 euros per euro invested.
Which benefits should be reported separately from the ROI?
Not all relevant effects can be reliably quantified in monetary terms. That does not make them worthless. They simply should not be included in the ROI formula without a robust data basis.
Examples of qualitative or strategic benefit categories include:
- equal access to information for frontline workers and staff without a fixed PC workstation,
- perceived transparency and guidance,
- Confidence in internal communication,
- Opportunities for participation and feedback,
- Promoting corporate culture and a sense of belonging,
- the ability to communicate more quickly in specific situations,
- consistent mobile access to relevant services.
Report these figures in a separate section of the Value Scorecard. This ensures that the financial ROI remains methodologically sound, whilst strategic effects remain visible.
How does Polario improve the conditions for delivering measurable benefits?
As an employee app, Polario can provide mobile and web-based access to information, content and opportunities for interaction. The economic benefits this generates depend on the specific use case, the initial situation, the roll-out and actual usage.
The following points are particularly relevant for a business case:
- Content and structures can be managed using a no-code CMS.
- Target groups, roles and access levels can be configured for each organisation.
- Existing data or services can be connected via interfaces and integrations.
- The platform provides usage and interaction data that can be incorporated into an organisation-specific performance measurement system. Before the project begins, it is essential to clarify which key performance indicators are available for the respective scope of functions.
- According to Polario, the hosting takes place in Germany. The data flows, subcontractors, supporting documentation and contractual documents relevant to the specific project should be examined as part of the compliance audit.
Polario does not guarantee a specific ROI. The platform provides the technical and organisational framework required to implement defined communication and service scenarios. Whether this results in a positive return on investment must be assessed on the basis of your own costs, processes and measurement data.



How can the ROI be improved after the launch?
Prioritise relevance over functionality
A long list of features does not necessarily mean the app will be used. Prioritise use cases that solve a common problem or noticeably simplify an existing process. The article ‘Requirements for an employee app’ helps you identify features based on real-life usage scenarios.
Reaching different target groups
Location, role, language and work context all influence which content is relevant. Communication tailored to the target audience reduces information overload and increases the likelihood that important messages will actually get through.
Treat the roll-out as a change project
Launch communications alone are not enough. Responsibilities, local advocates, training, feedback and clear rules of use are all part of the roll-out. The guide to introducing an employee app provides a step-by-step structure.
Check the effectiveness regularly
Check on a monthly or quarterly basis whether usage metrics, outcomes and business indicators are moving in the desired direction. Actions should be based on data and feedback, not on activity for its own sake.
Update the business case with actual data
Gradually replace planning assumptions with measured values. Document changes to the scope of functions, the number of users and costs. This transforms the original decision-making document into a management tool for day-to-day operations.
Common mistakes when calculating ROI
- 1. Only licence costs are taken into account: internal implementation, editorial work and operation are not included.
- 2. Equate downloads with value: Registration and activity do not in themselves demonstrate any business impact.
- 3. Fully capitalise on time savings: Not every spare minute is used productively or cost-effectively.
- 4. Treat correlation as a cause: parallel projects, seasonal factors and managerial behaviour can influence results.
- 5. Attribute staff turnover entirely to the app: there are many factors that influence staff retention.
- 6. Presenting planned figures as actual results: Model calculations must be identified as assumptions.
- 7. Looking only at the first year: One-off costs and cumulative usage can distort the picture.
- 8. Ignoring qualitative benefits: Strategic effects belong on a supplementary scorecard.
Conclusion: A credible ROI starts before the launch
The ROI of an employee app cannot be derived from a blanket estimate of time saved or a high activation rate. A robust business case combines total costs, clearly defined usage scenarios, a documented baseline and conservatively quantified benefits.
The economic assessment should set out ROI, TCO, payback period and qualitative benefit categories separately. This makes it clear whether the app covers its costs, when the investment will pay for itself, and what additional strategic value it creates for communications, HR and operational departments.
Sources and editorial basis
- AMEC – Integrated Evaluation Framework: https://amecorg.com/amecframework/
- AMEC – Planning and distinguishing between outputs, out-takes, outcomes and impact: https://amecorg.com/amecframework/home/supporting-material/planning/
- Staff app: https://polario.app/de/mitarbeiter-app/
- Costs of an employee app: https://polario.app/de/kosten-mitarbeiter-app/
- Prices and versions: https://polario.app/de/preise/
- Requirements for an employee app: https://polario.app/de/anforderungen-mitarbeiter-app/
- Choosing an employee app: https://polario.app/de/beste-mitarbeiter-app-finden/
- Launch of an employee app: https://polario.app/de/einfuehrung-mitarbeiter-app/
- API and Integration: https://polario.app/de/api-integration/
- No-Code-CMS: https://polario.app/de/no-code-content-management-system/
- Compliance: https://polario.app/de/compliance/
Frequently asked questions (FAQ)
How do you calculate the ROI of an employee app?
The total monetised benefit is reduced by the total costs. The remaining net return is divided by the total costs and multiplied by 100: ROI = (benefit – costs) ÷ costs × 100.
What costs need to be taken into account?
The following must be taken into account: one-off external costs, ongoing licence and service costs, internal project costs, and the ongoing costs of editorial work, administration, support and performance measurement. The period under consideration must be the same for both costs and benefits.
Which KPIs are suitable for an employee app?
The appropriate KPIs depend on the objective. Leading indicators include activation, active usage, reach and engagement. Outcome metrics measure, for example, discoverability, understanding, satisfaction or a reduction in enquiries. Financial metrics capture time saved, process costs or errors avoided.
When does an employee app deliver a positive ROI?
The ROI is positive as soon as the monetised, attributable benefit exceeds the total costs. This may be the case in the first year or only after a longer period. A positive planned figure does not yet constitute a proven actual ROI.
How can the time saved be quantified?
Multiply the plausible number of hours saved by a reasonable full-cost rate and a conservative estimate of the proportion of productive time. This avoids automatically treating every minute saved as a realised financial benefit.
Should employee satisfaction and engagement be included in the ROI formula?
Only if a financial link can be substantiated with reliable data and a justified allocation percentage. Otherwise, satisfaction, trust and commitment should be reported separately as qualitative or strategic outcomes.
What is the difference between ROI and TCO?
TCO takes account of all costs over the period under consideration. ROI compares the net return with these costs. Without a complete TCO, the ROI calculation is also incomplete.
Can a pilot help with ROI measurement?
Yes. A pilot scheme enables baseline and post-implementation measurements to be taken within a defined target group. Comparable locations or a phased roll-out can also help to better assess the impact of other changes.