Analytics Feature
From data to decisions
With our analytics feature, you gain valuable insights into the usage behaviour of your platform – from real-time data and activity periods to the performance of individual content. This allows you to not only understand what is currently happening, but also to make data-based decisions for future projects.
Your data in the big picture
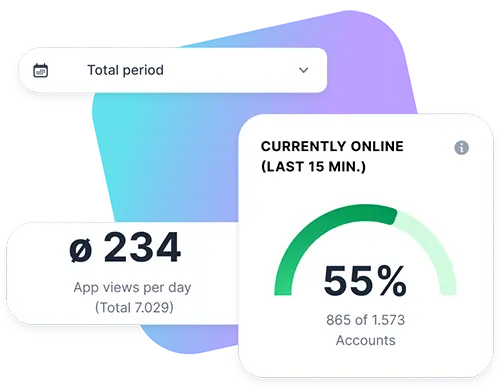
Define individual observation periods with just a few clicks to recognise relevant trends at an early stage and keep an eye on long-term developments. Whether you want to analyse the last month or observe the entire year – our flexible time frames help you to look at exactly the sections that are important for your evaluation.
What can be tracked?
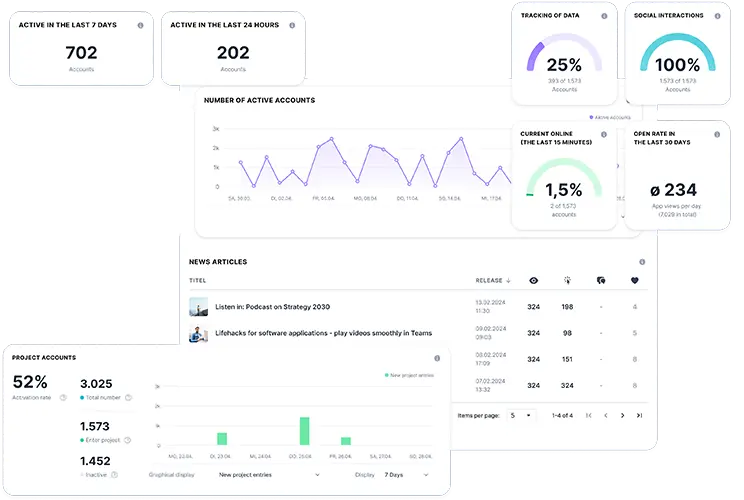
Account Infos
- Rate of activation
- Total number
- Enter project
- Inactive accounts
Overview
- Currently online (in the last 15 minutes)
- Open rate in the last 30 days
- Accounts with active user tracking
- Accounts with social interactions activated
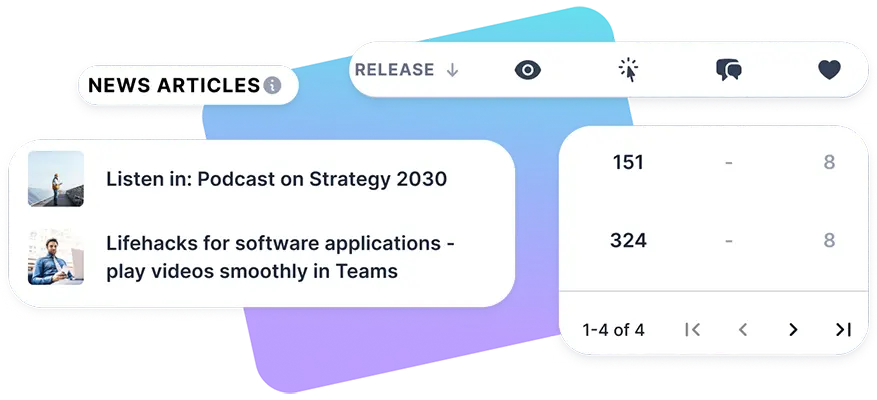
Published content
- Publication date
- Impressions
- Views
- Comments & Likes
Activities
- Active in the last 24h
- Active in the last 7/30 days
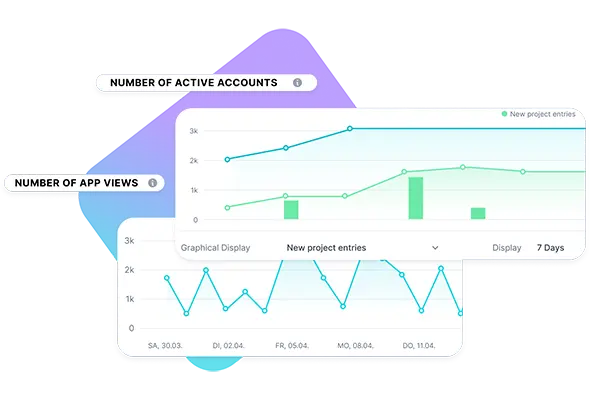
- Number of active accounts
- Number of app views
Time sequences that tell your story
Transform complex data into clear, understandable visualisations. Thanks to interactive charts and diagrams, you can recognise fluctuations, daily or weekly trends at a glance and keep your platform on track at all times. Get answers to questions such as: ‘When are my users most active?’ or ‘At what time do my posts generate the greatest response?’
Performance check of posts & pages
Understand the performance of your content down to the last detail. Our analytics tool provides you with meaningful key figures for publications, impressions, views, comments and likes. You can immediately see which topics are particularly popular, which content deserves more attention and how you can develop your strategy in a targeted manner.
Application Examples
- Evaluation of app use
- Real-time monitoring of app usage
- Effectiveness of posts & pages
- Insights for future planning
Discover more features
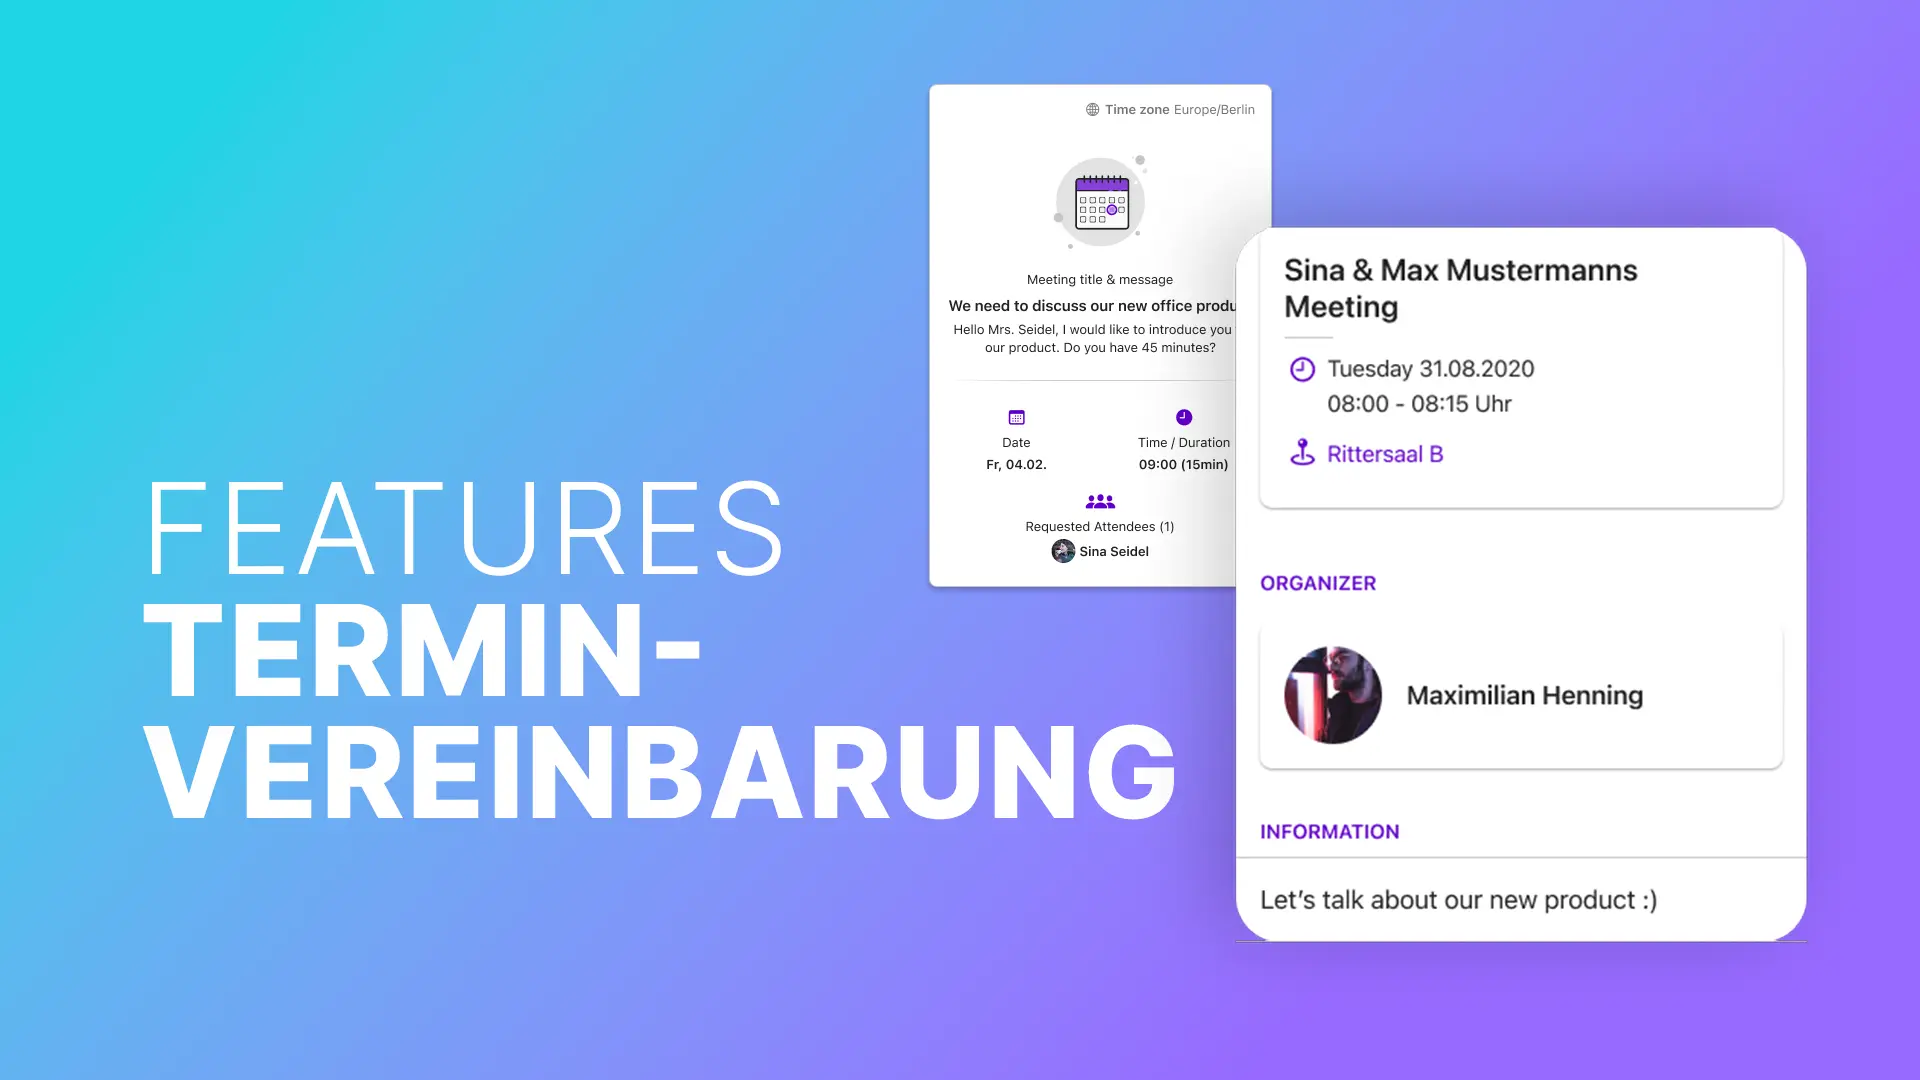
Polario makes scheduling appointments easy: centrally manage slots and plan meetings efficiently – for events, teams, communities and real encounters.

With the Polario Hub, you can deploy your app in minutes – without having to publish it yourself and completely in your company’s design.
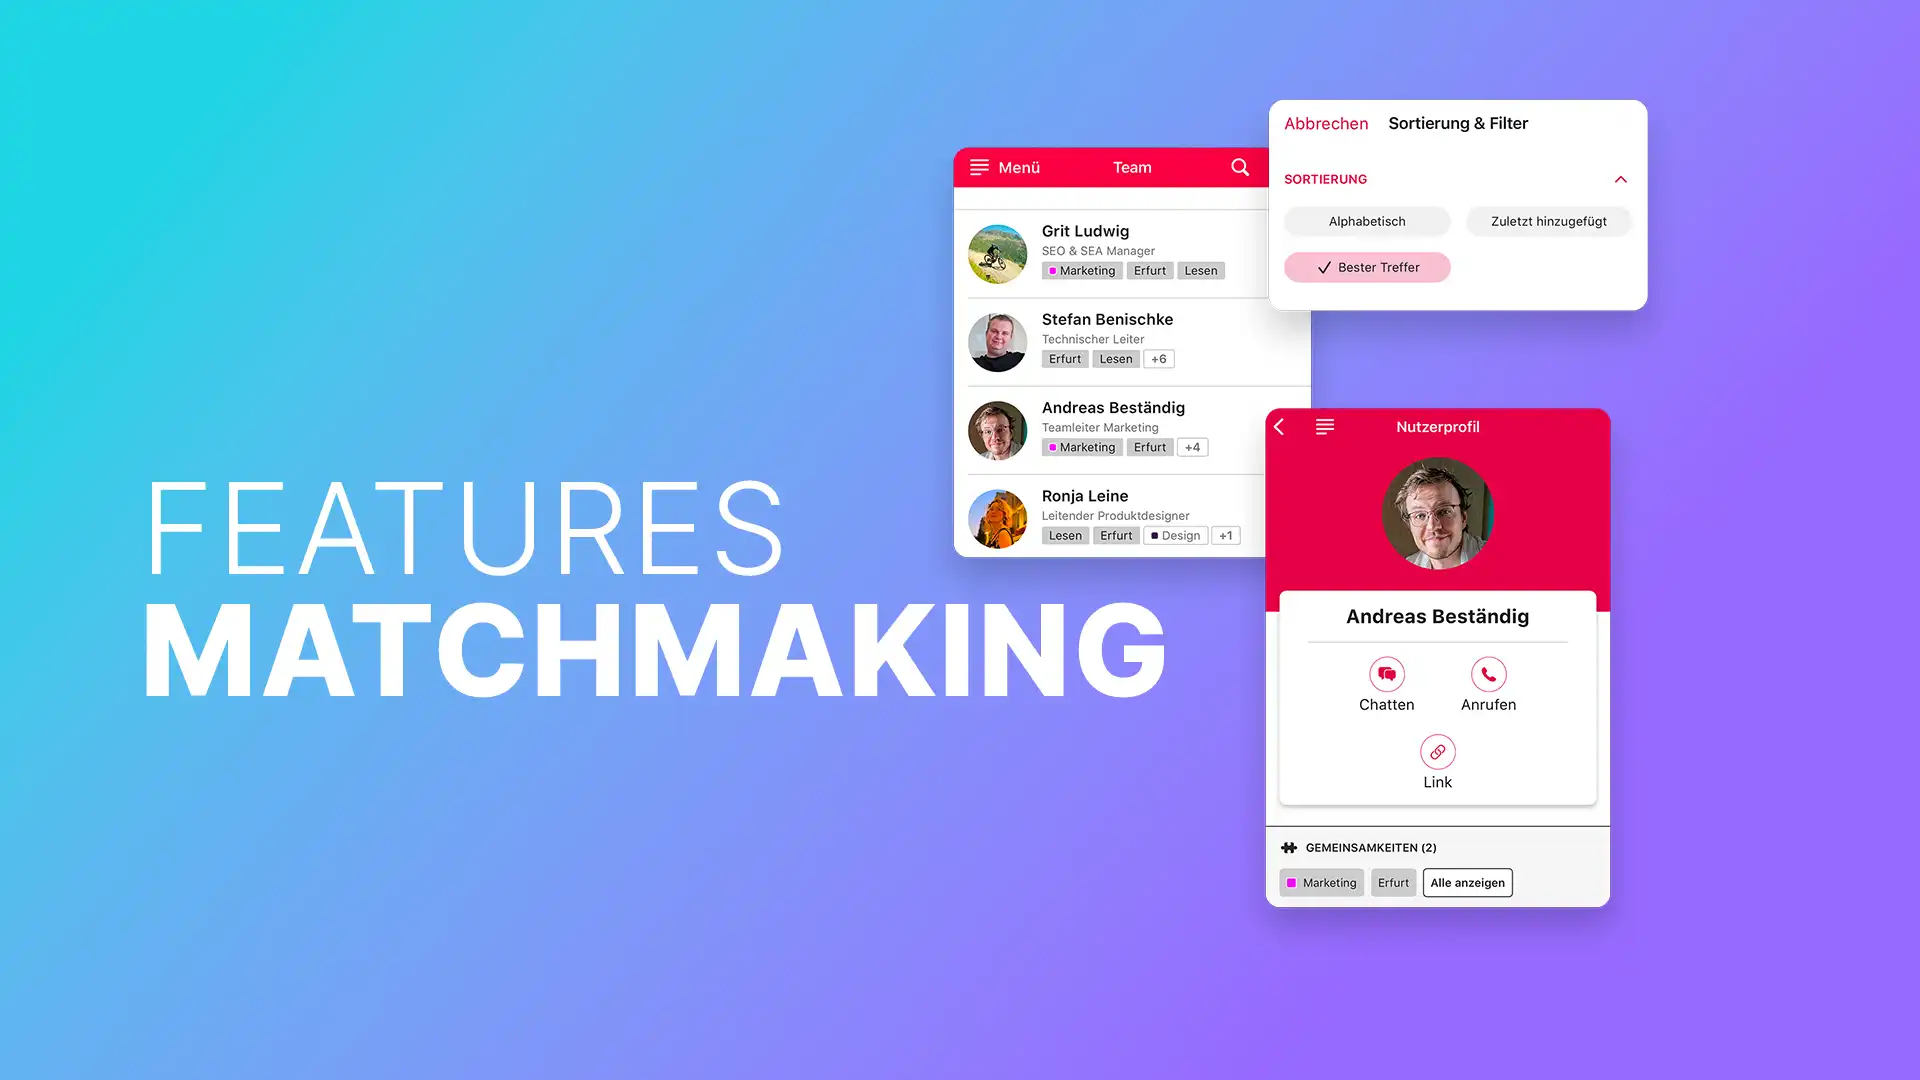
The Polario Matchmaking feature connects people in a targeted way – for better exchange, relevant contacts and smart networking in your app.

Polario makes scheduling appointments easy: centrally manage slots and plan meetings efficiently – for events, teams, communities and real encounters.

With the Polario Hub, you can deploy your app in minutes – without having to publish it yourself and completely in your company’s design.